Study Dashboard
The Study Dashboard serves as a home base for your study, giving you relevant details regarding activity within the study. It also lets you view study results and provides pathways to various interfaces to configure your study.
Navigating to the Study Dashboard
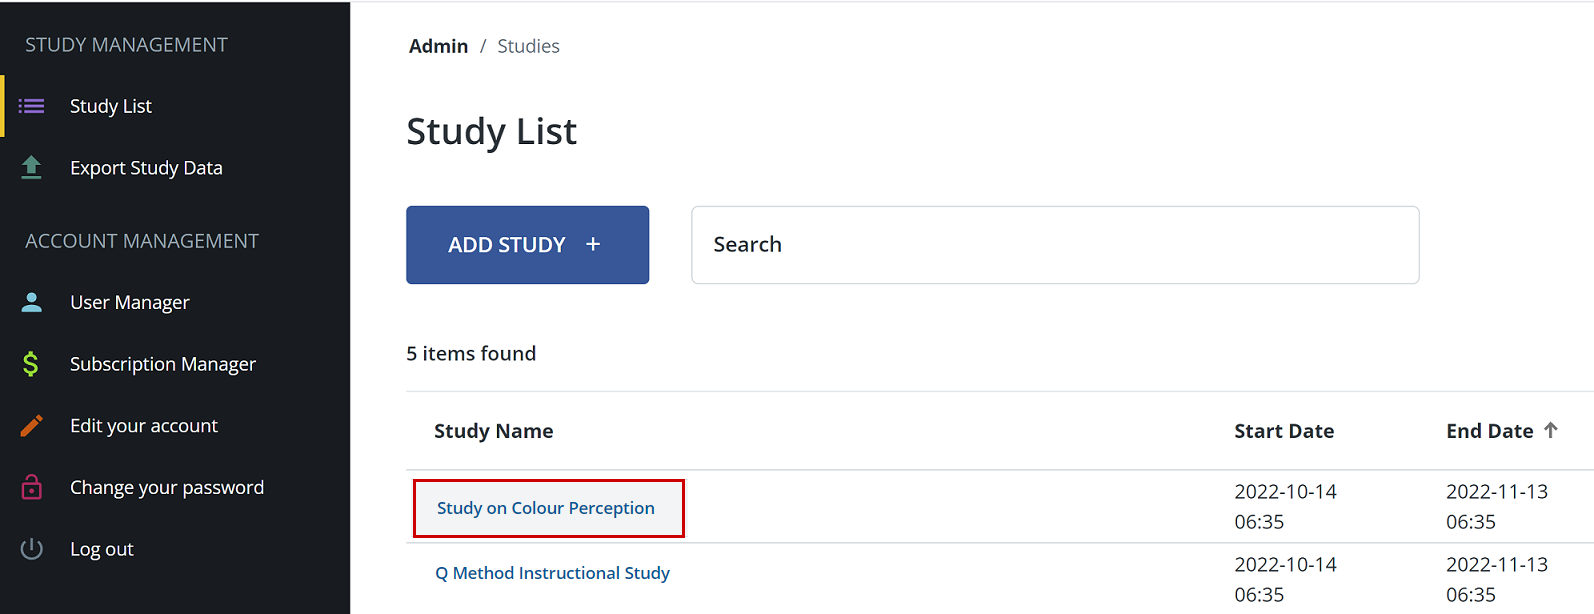
You can reach a study's dashboard by clicking on the study name in the Study List interface.
Study Dashboard Sections
The Study Dashboard has several sections:
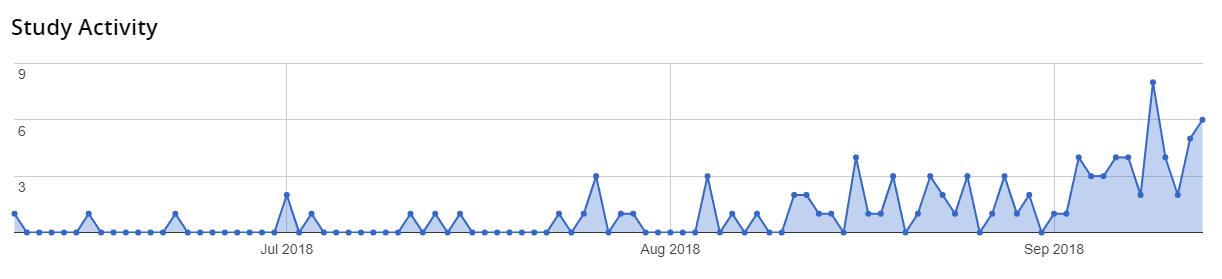
Study Activity
The Study Activity section displays a line graph of submissions by study participants. You can hover over each point in the graph to get a summary of that day's submissions.
Completed Widget
Shows you how many participants have successfully completed the study.
In Progress Widget
Shows you how many participants have begun taking the study, but have not yet submitted.
Not Started Widget
Displays a count of participants who have not yet started the study.
Average Time Spent Widget
Displays the average time that a participant has spent to complete the study.
Status Widget
Shows an indicator to indicate the general health of your study, and if any items require attention.
Study Configuration Table
This table gives you an overview of your current study settings for your reference.
Study Log
Displays timestamped log entries for when a participant begins a study instance, as well as when they submit their instance.